
Quick navigation:
Overview
- Map layers:
Population density
, Annual incidence
, Finetypes
, Serogroups
This site provides a brief description of the functionality of EpiScanGIS. Please click here to launch the web application, which lets you monitor invasive meningococcal disease in Germany.
Using the numbers in the figure below, we will explain which settings may be taken using the respective controls of the application and which information is displayed on the relevant areas.
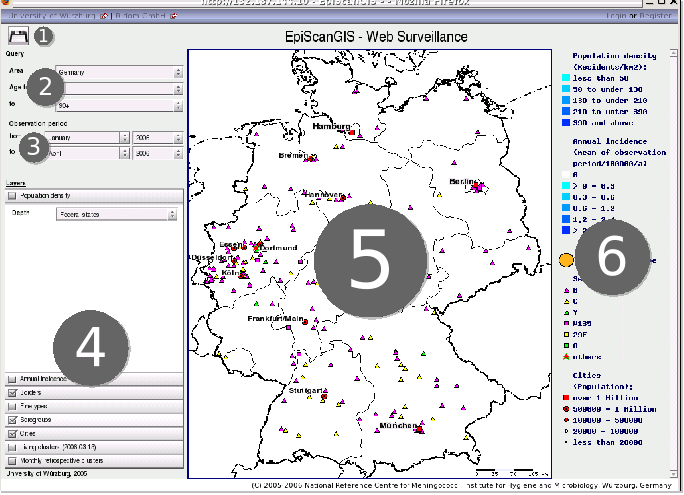
Screenshot of the EpiScanGIS web application, numbering explained below
The interface of the map viewer offers the following settings:
Geographical information systems typically organize digital maps using layers. Information, that belongs together, is thereby grouped in one layer.
EpiScanGIS uses amongst others the layers Population density, Annual incidence, Serogroups, Finetypes and Borders.
Elements combined in one layer are always of same geometric type. Borders and incidence are planar, cities and cases of disease are are point information. The separate layers generate the overall picture of the map. You can alter the view by enabling or disabling single layers.
Below we are going to explain each layer and the settings, that can be taken respectively:
Calculates the population density. This can either be done on basis of federal states or counties.
The figure below shows two examples for this layer:
Population density on basis of federal states and counties respectively,
including borders
Shows the annual incidence of meningococcal disease for federal states and counties. The calculation refers to all cases of the selected serogroup(s) that occurred during the given period.
The number of cases is extrapolated if the period is shorter than one year and interpolated otherwise.
The figure below shows two examples for this layer:
Annual incidence of all cases in 2002 (January-December)
for Federal states and counties.
Displays the distribution of one meningococcal finetype (epitope sequence typing of PorA and FetA) on the map. The number of shown cases is contained by age group and period. You can find a specific finetype by using the provided search field.
IMPORTANT: You have to enter the finetype exactly as defined below:
{Serogroup} : P1.{PorA} : F{FetA}, for instance B : P1.7-2,4 : F1-5
Please mind the spaces to the left and right of the colons.
The figure below shows two examples for this layer:
Distribution of finetype B : P1.7-2,4 : F1-5 in Germany and North
Rhine-Westphalia (January to October 2005)
Visualizes cases of meningococcal disease grouped by serogroup.
The number of shown cases is contained by age group and period. You can display cases of different serogroups at the same time by holding down the Ctrl-key while selecting an item from the list.
Different symbols and colors flag the serogroup B, C, Y, W135, 29E, A and Z unambiguously.
The figure below shows two examples for this layer:
Cases of serogroup B and C respectively in Germany in 2002